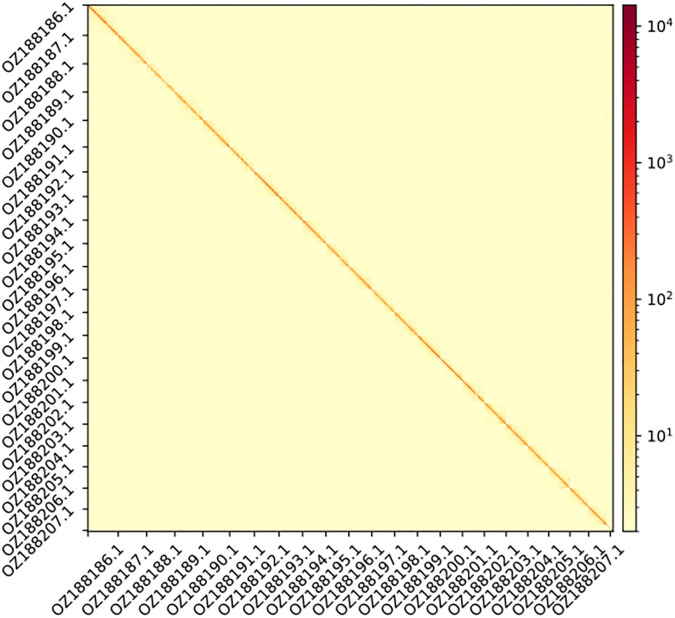
Figure 2. . Hi-C contact map showing spatial interactions between regions of the genome.The diagonal corresponds to intra-chromosomal contacts, depicting chromosome boundaries. The frequency of contacts is shown on a logarithmic heatmap scale. Hi-C matrix bins were merged into a 150 kb bin size for plotting.
Image published in: Vasileiadou K et al. (2026)
Image downloaded from an Open Access article in PubMed Central. Copyright: © 2026 Vasileiadou K et al.
Permanent Image Page
Printer Friendly View
ECB-IMG-208659