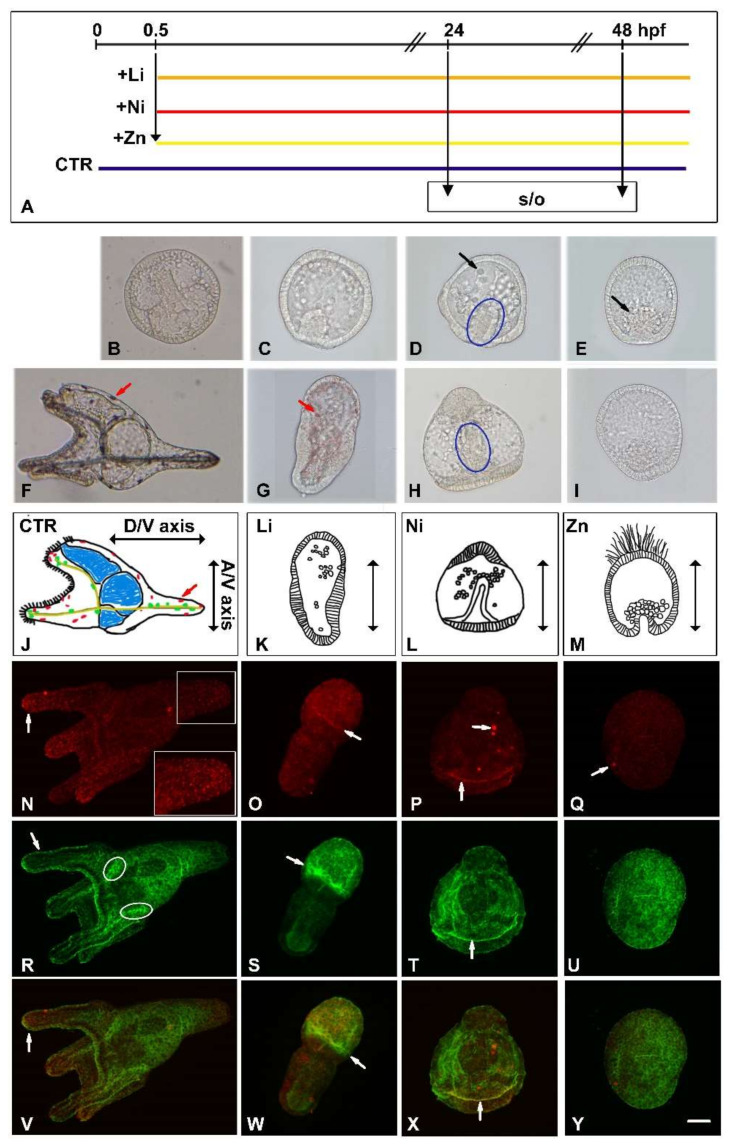
Figure 1. Morphologies of P. lividus embryos treated with Li, Ni, and Zn. (A) Schematic drawing of Li, Ni and Zn treatment experiments. Black line, hpf, in the upper part; the first vertical arrow indicates addition of 30 mM LiCl (Li), 0.5mM NiCl2 (Ni), 0.1mM ZnSO4 (Zn) at 0.5 hpf. Periods of treatment with Li, orange line; Ni, red line; Zn, yellow line. Untreated embryos (CTR), blue line. s/o indicates sampling (s) for NanoString nCounter gene expression assay and qPCR analyses and (o) microscopic observation. Embryos were observed at 24 (B–E) and 48 (F–I) hours post-fertilization (hpf). Untreated embryos: (B) control gastrula; (F) control pluteus. (C,G) Li-embryos; (D,H) Ni-embryos; (E,I) Zn-embryos. Blue ellipses in (D,H) indicate short archenteron. Black arrows in (D,E) indicate cells grouped inside the blastocoelic cavity. Red arrows in (F,G) indicate pigment cells. Schemes of embryos at 48 hpf: control pluteus, CTR (J); Li-embryo, Li (K); Ni-embryo, Ni (L); Zn-embryo, Zn (M). Animal/Vegetal (A/V), Dorso/Ventral (D/V) axes are indicated in the scheme of pluteus embryo. (N–Q) Anti-Sox2 antibody (red); (R–U) Ab-295 (green); (V–Y) Merged images (yellow) of the relative Anti-Sox2 (N–Q) and Ab-295 (R–U) images, respectively. The image in the white frame in (N) indicates 1.4× magnification of the pluteus apex, where brightness and contrast have been increased. White arrows in (N–Q) indicate Sox2-positive cells. White ellipses in (R) indicate small central ganglionic structures. White arrows in (R–T) and (V–X) indicate ciliary band. Bar 20 μm for (B–I) and (N–Y).
Image published in: Bonaventura R et al. (2022)
Image downloaded from an Open Access article in PubMed Central. © 2022 by the authors.
Permanent Image Page
Printer Friendly View
ECB-IMG-193055