
ECB-IMG-195231
Echinobase Image ID: 195231
|
|
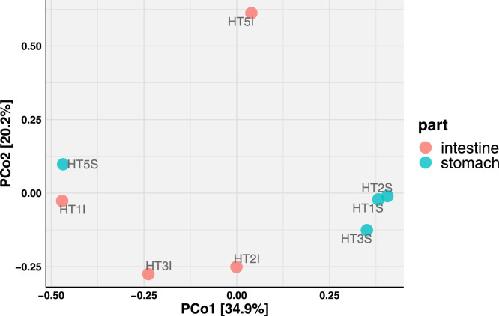
Fig. 3. Principal Coordinates Analysis (PCoA) plot of gastrointestinal tract samples based on bacterial microbiome composition. The first two principal coordinates captured 55.1% of the total variation. Image published in: Kyritsi M et al. (2023) Image downloaded from an Open Access article in PubMed Central. © 2023 The Author(s). Published by Informa UK Limited, trading as Taylor & Francis Group. Larger Image Printer Friendly View |